Seeing is Believing:
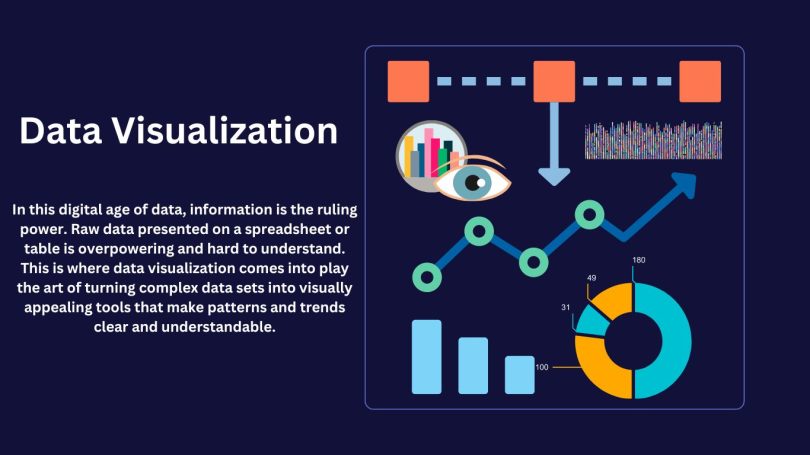
In this digital age of data, information is the ruling power. Raw data presented on a spreadsheet or table is overpowering and hard to understand. This is where data visualization comes into play the art of turning complex data sets into visually appealing tools that make patterns and trends clear and understandable.
A Comprehensive Guide to Data Visualization:
Much more than making data good-looking, data visualization is also about telling fact and figures of stories.
It is a powerful communication tool that allows you to complete the following tasks…
- Simplify complex information: Turn multifaceted data sets into accessible visuals that appeal to a broader public, including those who lack analytical capabilities.
- Identify trends and patterns: Find concealed insights that are not obvious in text reports and discover relationships between the data.
- Support decision-making: This is a clear approach to share the insights, and thus inform better business strategies, marketing campaigns and scientific research.
- Boost audience engagement: Engage your audience and foster information remembering through visually appealing presentations.
The Building Blocks of Effective Data Visualization:
The basis of data visualization is explained.
Effective data visualizations rely on several key elements.
Data Source:
The first and foremost thing underlying any data visualization is the clean and accurate data. This may be from databases, surveys, experiments, social media or any other source that produces measurable information.
Charts and Graphs:
These are the primary tools of data visualization which can be used in different ways such as vertical or horizontal bars, line charts, pie charts, scatter plots and heat maps. Every kind of chart has a specific purpose to visualize particular relationships or patterns within the data.
Colour Schemes:
In communication, colors perform the main job of transmitting meaning. Use colors that are not harsh on the eyes, distinguish data points precisely, and stick to common industry standards (for example, blue for cold and red for hot).
Labels and Annotations:
Clear labels and annotations on your visualization become your significant source of information even without any other context.
Design Principles:
The data visualization design is effective when it follows the key principles like white space, balance and hierarchy. This certifies that information is presented clearly and avoids visual clutter.
Popular Data Visualization Tools:
There’s a data visualization tool for everyone from a beginner to an expert. Here are some popular options.
- Free and Open-Source Tools:
Charting tools are commonly used and there are popular options, such as Tableau Public (free), Google Data Studio (free) or Python libraries, like Matplotlib and Seaborn (free).
- Paid Tools:
Such tools are usually of the high-end type and they offer features and functionalities that are not available in the regular office application suite. Examples are Tableau (paid), Microsoft Power BI (paid) and QlikView (paid).
Practical Applications of Data Visualization:
It holds significant importance across diverse sectors.
- Business Analytics: Monitor sales figures, customers’ behavior, and marketing campaign performance via graphs and charts.
- Science and Research: Transmit scientifically complex insights with powerful visualizations in research papers and presentations.
- Finance and Economics: Analyze the market trends, investment performance and economic factors.
- Healthcare: Tracking patient data, dynamic disease outbreak visualization and efficient communication of treatment results.
- Social Media: Check social media data to understand audience demographics, the reach of the campaign and brand sentiment.
Emerging Future Trends in Data Visualization:
Data visualization is a rapidly growing and developing field that is being shaped by new technologies and trends. Here are some exciting emerging future advancements to watch for.
Interactive Data Visualization:
Interactive visualizations allow users to discover and filter data in detail, make it dynamic and even drill to the specific details.
Data Storytelling:
Visualizing the data with the help of a captivating story becomes a powerful data-driven storytelling mechanism.
AI and ML:
AI and ML are being applied to automate the visualization of data and the generating of visions from complex datasets
Conclusion:
Data visualization serves as a potent instrument for unveiling the concealed truths within your data. Through adeptness in data visualization, you can transform intricate information into actionable insights; enabling both yourself and your audience to make well-informed decisions. So, explore and free your inner data narrator and start visualizing.


Leave a Comment